Exploring Uber demand in NYC

Summary
The dataset we used for this project included data on Uber cars' ridership in the city of New York for the first six months of 2015. As we were exploring it, we noticed that, against our initial intuition, the weather variables had not any or very weak impact on the ridership.
Going further in the analysis, it was getting more clear that the demand follows specific patterns both during the day and during the week.
Also, we noticed a general trend of rising demand during the six months, led the total demand from 2,000 pickups per hour to 3,500.
Using the above conclusions, we were able to model the demand with forecasting horizons from a week to next hour. These models can be used on several occasions. For example, someone could use the weekly forecasting model to have a general view of the next week's demand. On the other hand, a real-time system could compare the prediction per borough, with the positions of Uber cars and highlight the areas accordingly to drivers' applications helping them to roam more efficiently through the city.
Since the model is based on past observations, it is prone to wrong estimations on very irregular conditions. Additionally, since current observations affect future prediction, demand out of the ordinary levels may lead to wrong estimations at some point to later predictions.
(Note: This is a brief report of the results. Also available, the full analysis and the R Notebook.)
Final Plots and Summary
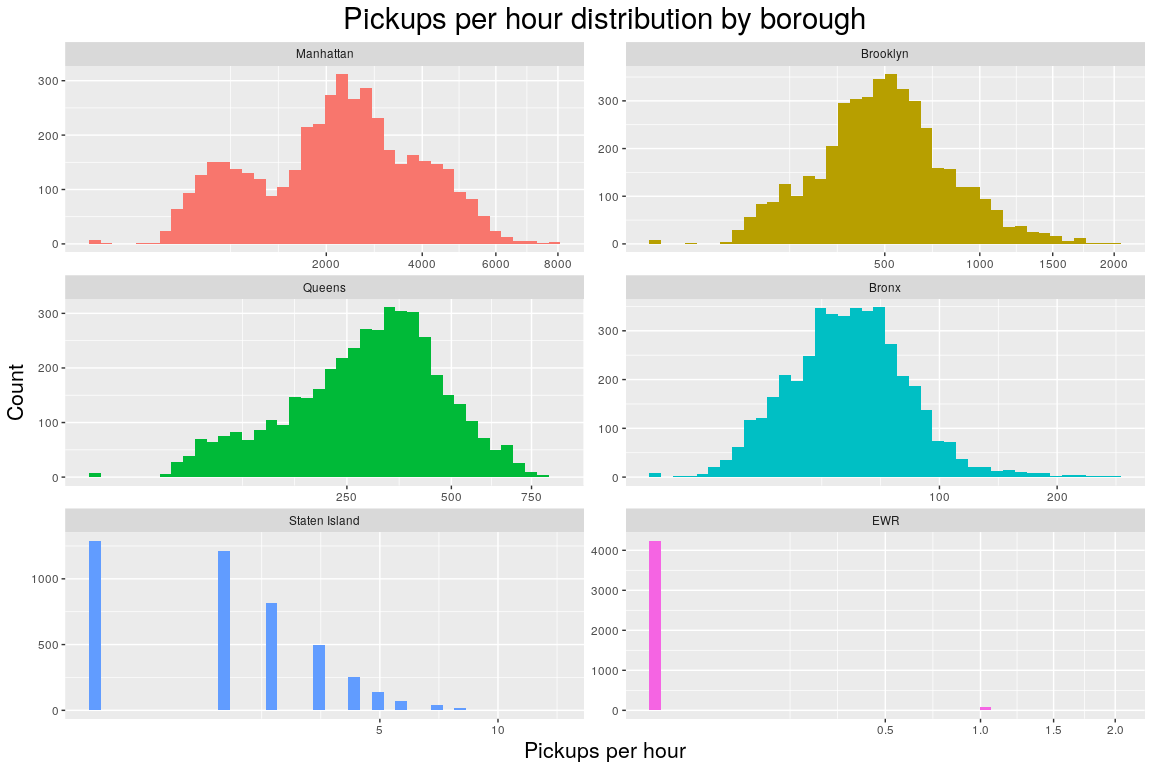
Pickups Distribution
The distribution of the four major boroughs, on a square rooted scale, are mainly normal to bimodal because of the quick rise of the demand during the morning hours.
Staten Island's pickups follow a geometric distribution because of the minimal demand in the area.
Finally, on EWR the demand is practically zero with a very few pickups that we may consider as outliers.
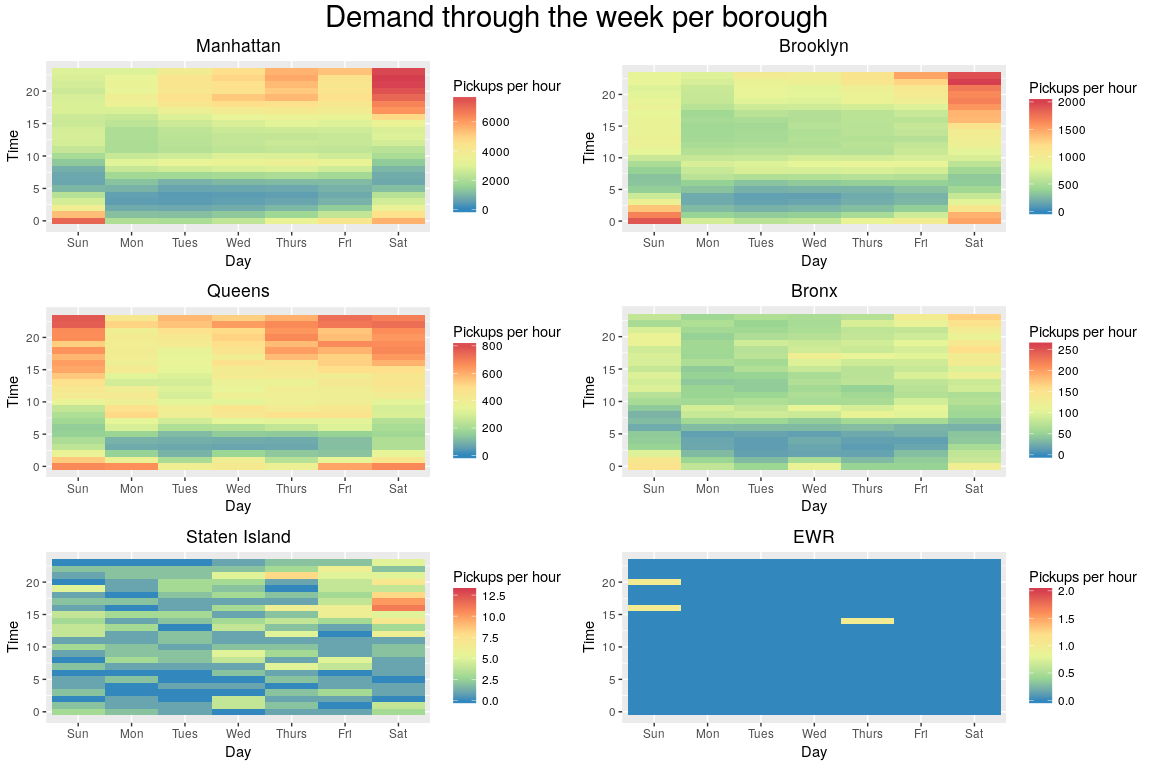
Weekly Demand
The four major boroughs follow the same pattern both during the day and through the week.
On working days the demand falls after midnight and then at around 6 o'clock start rising quickly, then it hits a plateau during the afternoon and then rises again during the evening/night. On the X axis (during the week), the demand starts low on Monday and then rises until Saturday, when it tops and then on Sunday starts falling again. This pattern is more evident on Manhattan and Brooklyn.
On the two minor boroughs, Staten Island's demand looks random during the day, but again we can see that the demand slightly rises as we move through the week. EWR, as we noted before has practically no demand.
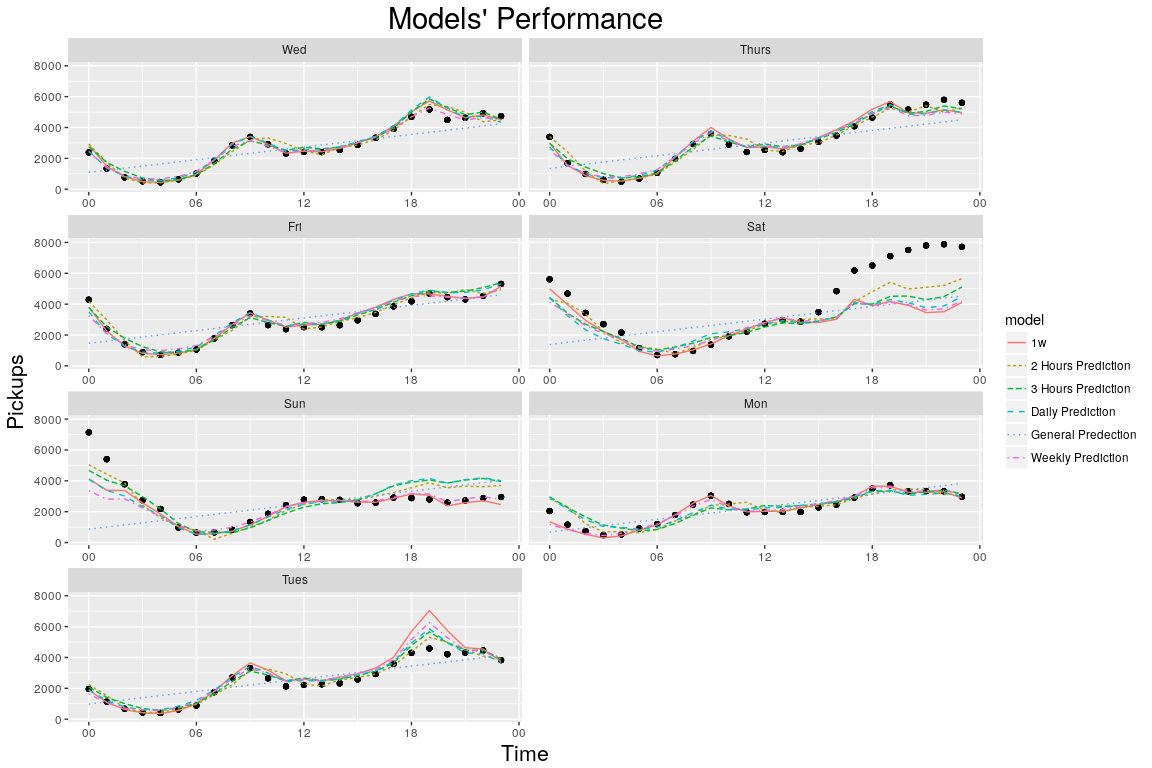
Demand Prediction
We concluded the Exploratory Data Analysis process with the creation of some models to predict the demand. In general, the models have a perfect fit with just one occasion of underestimating the actual demand on the highest day of the six months period.